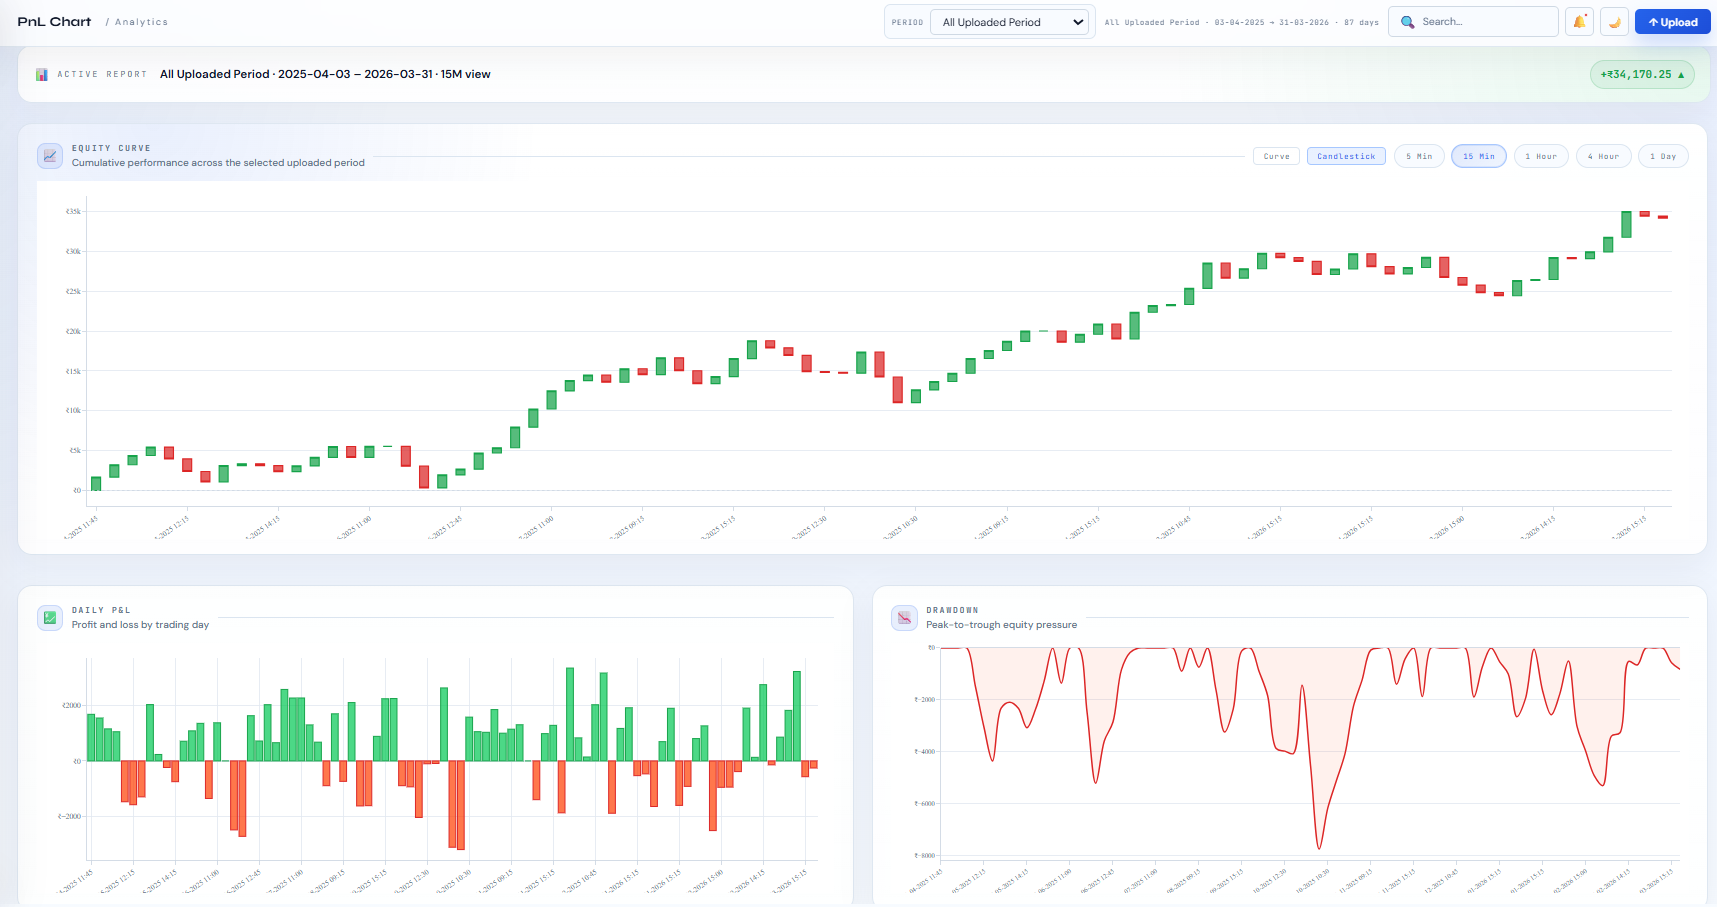
📊
Candlestick PnL Chart
See your running PnL as a real trading chart with 5M, 15M, 30M, 1H, 4H and 1D timeframes. Every candle shows exactly how your account moved that period.
FREE
⚠️
Overtrading Detector
Detects if you revenge trade within the same session after a losing period. Shows how many extra trades you take after each red candle — precise, timestamped evidence.
FREE
🕐
Session & Time Heatmap
Breaks your P&L down by every time window of the day. Find your golden session, your danger zone, and your average P&L per time bucket across all your trading days.
FREE
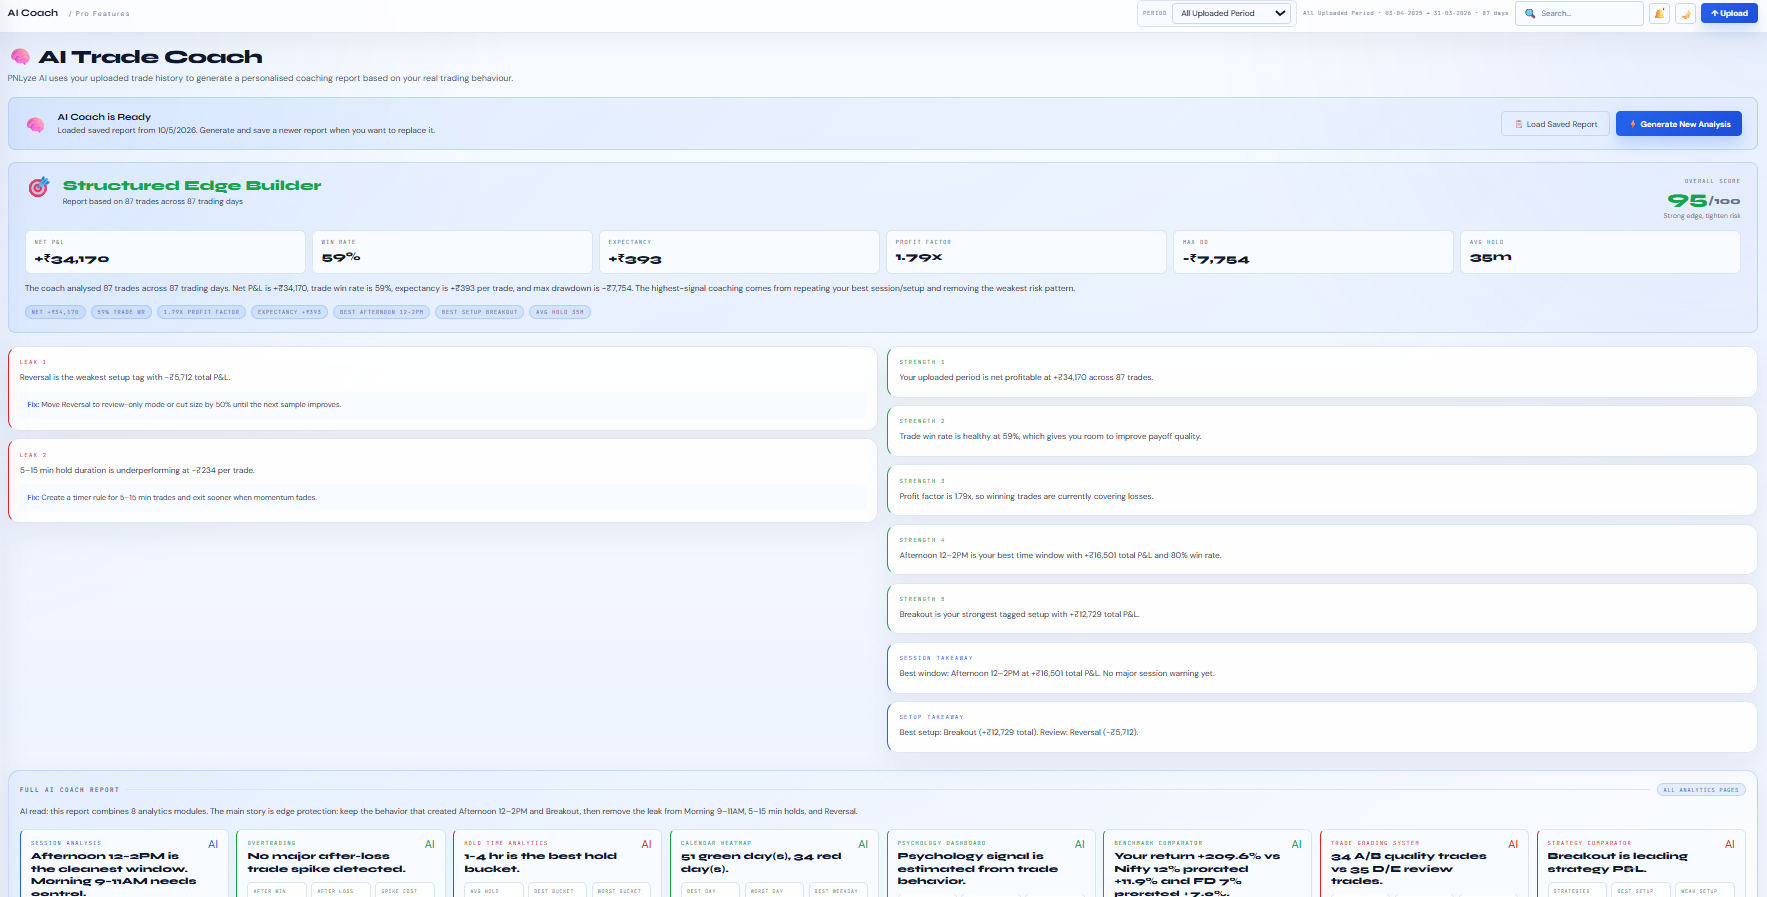
🧠
AI Trade Coach
AI reads your full trade history and writes a personalised written coaching report — specific to your patterns, your losses, your strengths. Like a mentor who read your whole journal.
GROWTH
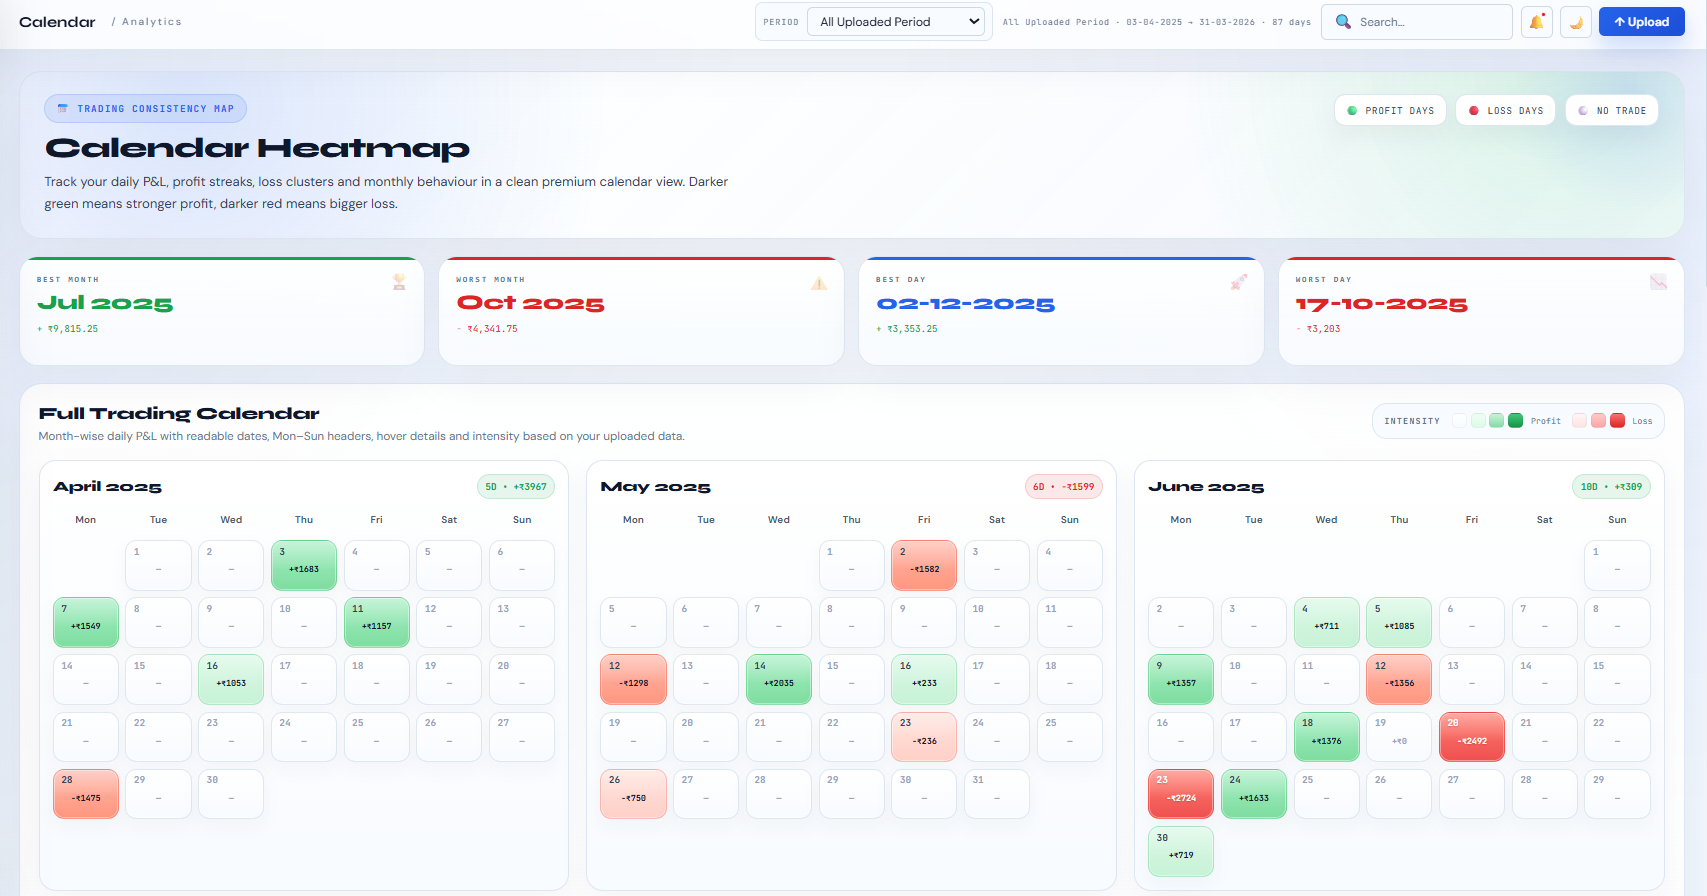
📅
Calendar Heatmap
Full year calendar coloured by daily profit and loss intensity — GitHub-style. Click any day to see complete trade breakdown. Instantly reveals weekly and monthly patterns.
GROWTH
📉
Drawdown & Risk Calculator
See your maximum drawdown, current equity drawdown from peak, and your risk of ruin based on actual win rate and position sizing. The number that protects your account.
GROWTH
🎯
Trade Grading System
Every trade scores A–F on entry timing, exit efficiency, hold duration and position size. Separates good trades that lost (bad luck) from bad trades that won (good luck). Pure discipline metric.
GROWTH
🔄
Strategy Comparator
Tag trades by setup type — Breakout, Reversal, Momentum, Gap-Up — and compare win rate, avg P&L and hold time per strategy side by side. Know exactly which to scale and which to cut.
GROWTH
📤
PDF Report Generator
One-click monthly performance PDF — equity curve, best and worst trades, session breakdown, AI coaching insights. Professional enough to review with a mentor or show family.
PRO
📁
Broker Import System
Select Broker Tradebook, Contract Note beta, PNLyze Format A, Format B or Custom CSV, then preview rows before anything touches your master dataset.
FREE
🔍
Preview, Validate & Deduplicate
See broker, mode, row count, invalid rows, duplicates, new trades, date range and total P&L before import. Duplicate trades are skipped automatically.
FREE
📝
Trade Journal
Review every trade with symbol, strategy, setup tag, broker, side, quantity, notes, status, running P&L and complete row-level detail.
FREE
🔎
Trade Journal Review
Open any trade, write a structured review, attach chart screenshots, record lessons, and keep the review connected to that exact master trade.
GROWTH
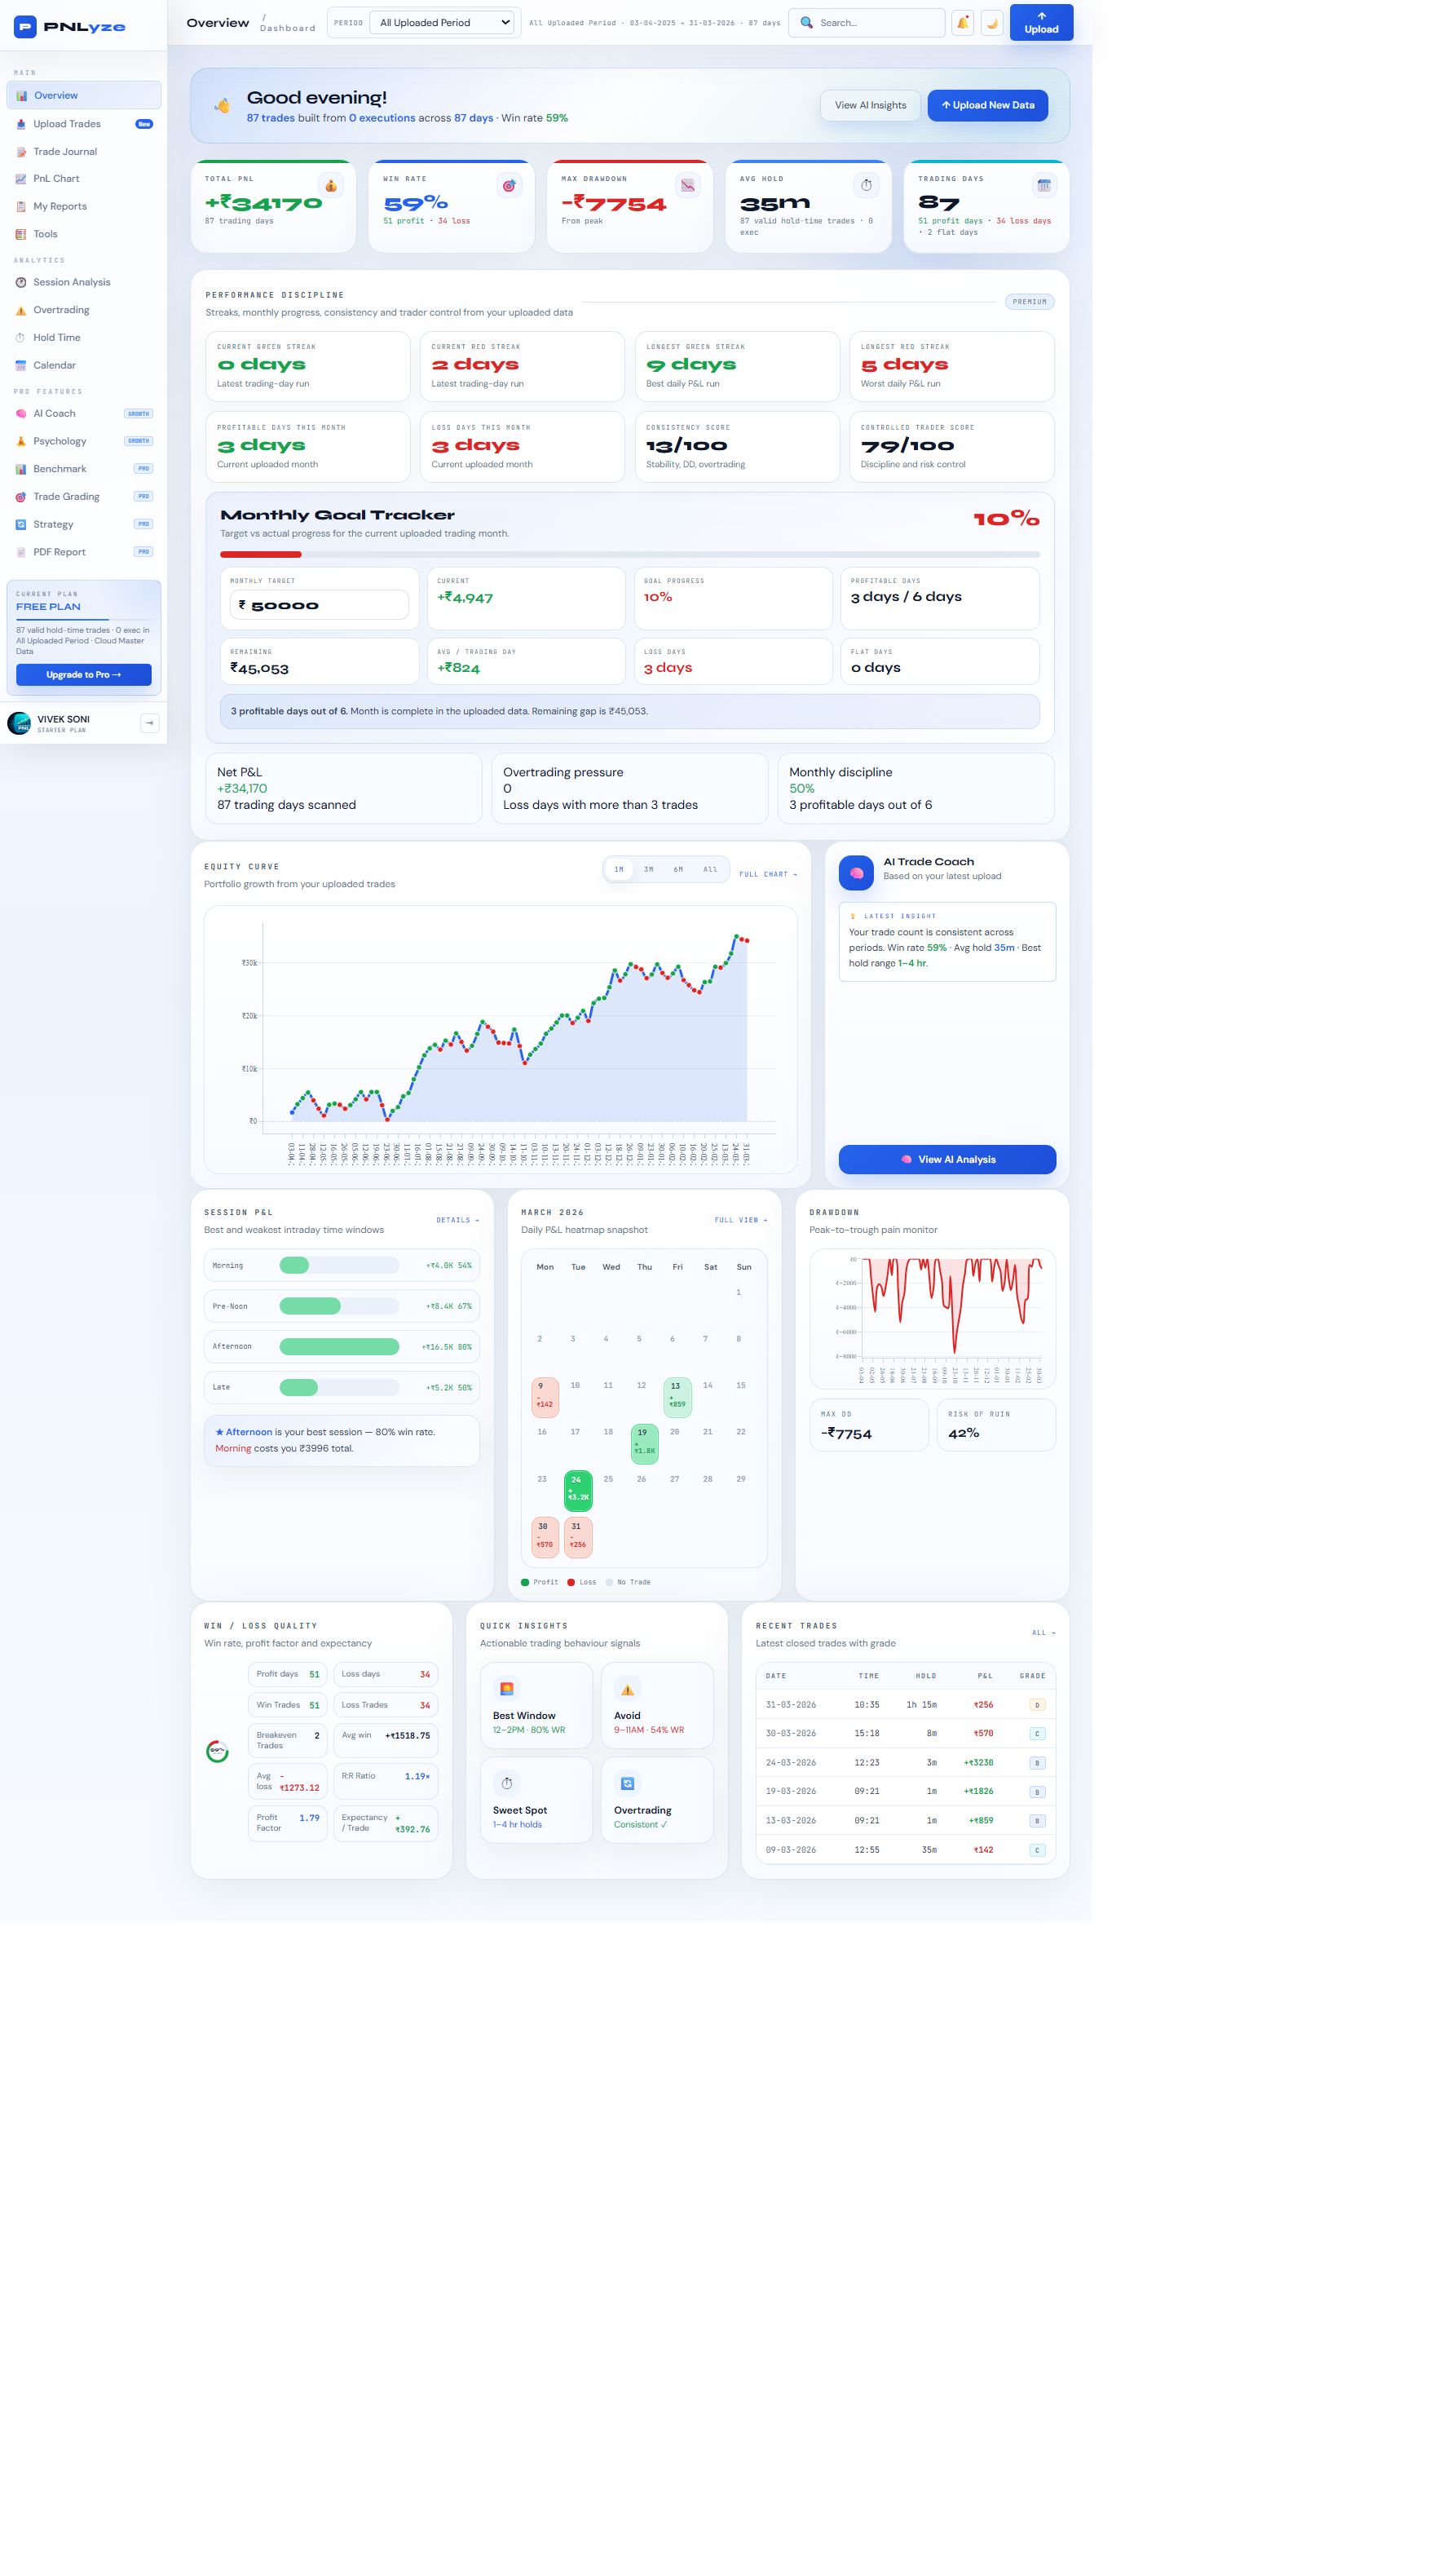
📈
Overview Dashboard
Track total P&L, win rate, expectancy, profit factor, drawdown, best trades, weak spots and account health from one clean screen.
FREE
🏁
Benchmark Comparison
Compare your trading performance against benchmark-style returns so you can see whether active trading is truly adding value.
GROWTH
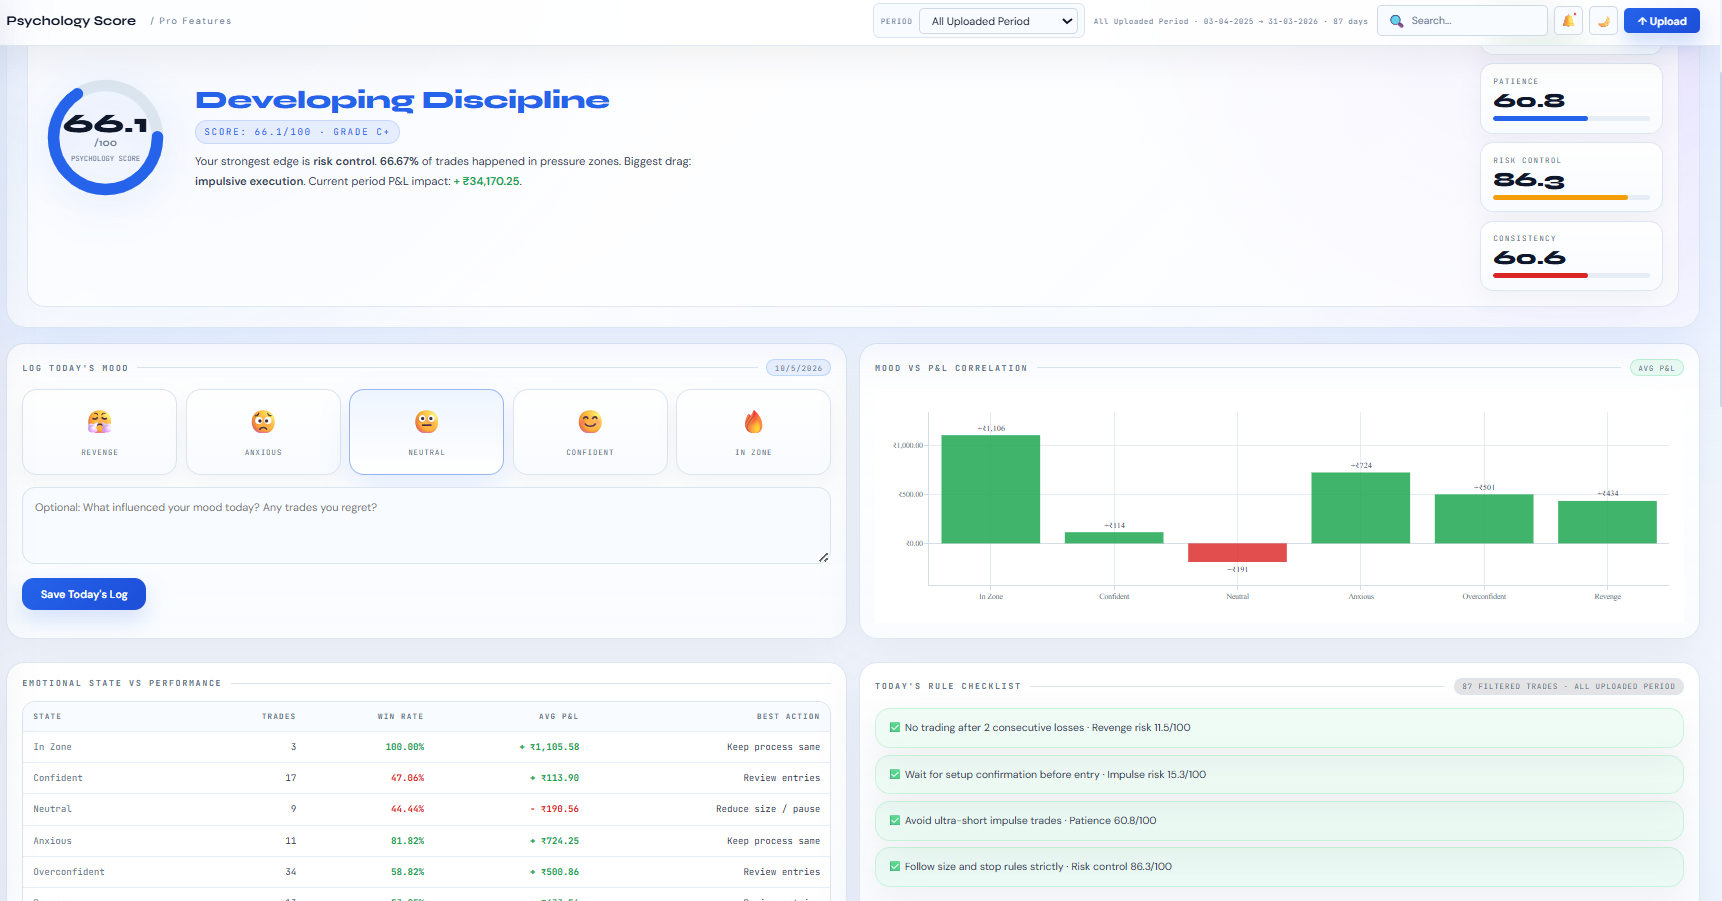
💬
Psychology Dashboard
Connect behavior signals, mood, discipline, revenge trading and P&L so your results explain how you trade, not just what you made.
GROWTH
⚠
Mistake Analytics
Tag review trades with mistakes, emotions and notes, then see which mistakes repeat most often and how much they cost across your history.
GROWTH
📅
Daily Mood Log
Log today's mood and trading notes on a daily basis, then use that history inside psychology insights and AI coaching reports.
GROWTH
💾
Saved AI Reports
Save the latest AI coach report and keep it available until you generate and save a newer report for the next review cycle.
GROWTH
🔒
Secure Account & Billing
Manage profile details, subscription plan, billing history, payment status and notification preferences from inside the app.
PRO
🔔
Trading Alerts & Notifications
Control performance emails, AI insight alerts, overtrading warnings and monthly report auto-generation from settings.
PRO
📋
Reports Vault
Track upload history with file name, broker, import mode, rows, imported trades, duplicate count and status. Reimport is supported when the original file is available.
GROWTH
🛠
Position Size & Risk Tools
Plan position size, daily risk and behavior guardrails using account rules and uploaded trading behavior.
GROWTH
⏱
Hold Time Analysis
Find your best trade duration, detect early exits, expose over-holding and compare hold-time buckets against P&L.
PRO